API Observability Requirements: SLOs, Log Fields, Metrics, and Alerts an Analyst Writes
Written by Ahmed at Analyst Engineering, a Senior Technical Business Analyst with 10+ years in banking and payments delivery.
Key takeaways
- Observability is a requirement, not a developer's preference. If the specification does not name the log fields, metrics, SLOs, and alerts, the API ships with whatever the framework emits by default, and the first incident discovers the gap.
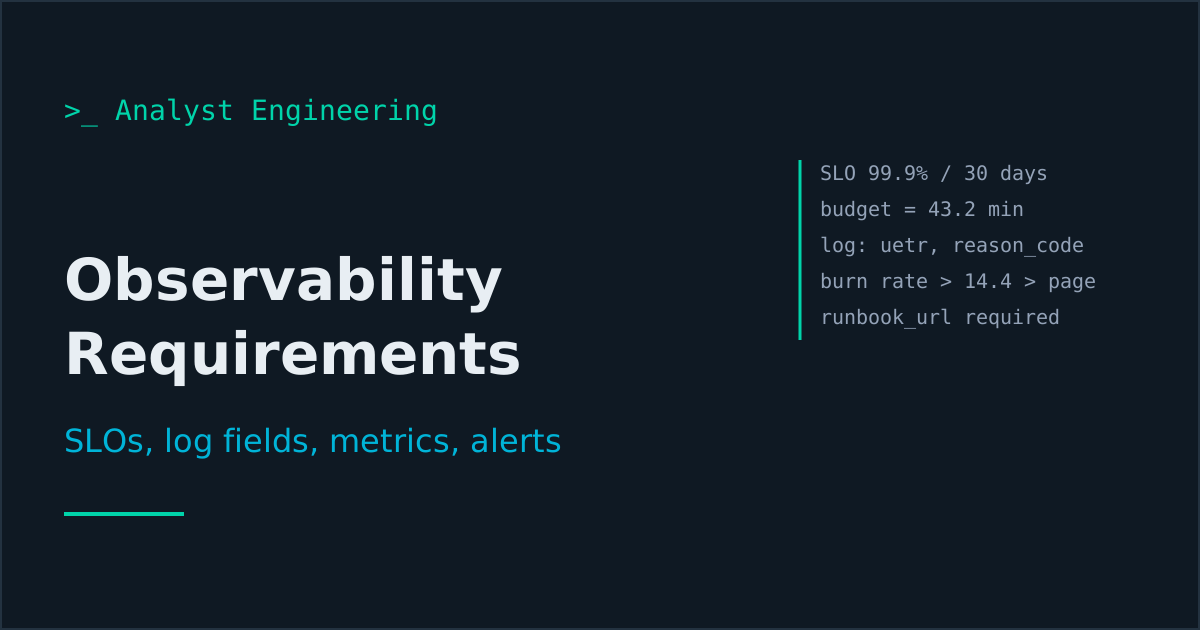
- Write an SLO as a ratio of good events over valid events in a fixed window, such as 99.9 percent of POST /payments requests answered without a 5xx over 30 days. That target implies an error budget of 43.2 minutes of total failure per 30 days.
- Every log line for a payment needs the same core fields: timestamp, service, trace_id, correlation id, internal payment id, UETR, event, status, and reason code. Names, IBANs, and remittance text never go in a log.
- Metric labels must be low cardinality. Scheme, channel, status, and reason code are good labels; payment id and UETR are not, because every distinct label value creates a new time series.
- An alert without a runbook link is a notification, not a control. Each alert definition needs a condition, a threshold, a window, a severity, an owner, and a runbook URL, and it should fire on a customer symptom rather than an internal cause.
API observability requirements are the non-functional requirements that make a payment API diagnosable in production: a service level objective (SLO) with its error budget, the structured fields on every log line, metrics with fixed names and low-cardinality labels, alerts with thresholds and runbook links, dashboards that show business outcomes, and Gherkin acceptance criteria that prove all of it in a test environment. If the specification does not say these things, the API ships with whatever the framework emits by default.
Every major incident I have worked ended with the same post-mortem action: “improve logging and monitoring”. That action is a requirement written too late. The analyst who specifies the API is the person best placed to write it early, because observability is mostly about business identifiers and business outcomes, and those are in the analyst’s head, not the framework’s. This is a systems analyst deliverable that sits next to the contract in the APIs for Analysts path, and it extends the general method in non-functional requirements.
What are the four golden signals for a payment API?
Google’s Site Reliability Engineering (SRE) book names four signals to monitor on any user-facing system: latency, traffic, errors, and saturation. Translated to a payment initiation API:
| Signal | SRE definition | Payment API version |
|---|---|---|
| Latency | Time to service a request, successful and failed measured separately | p50, p95, p99 of POST /payments, split by outcome |
| Traffic | Demand on the system | Payments submitted per minute, by scheme and channel |
| Errors | Requests failing explicitly, implicitly, or by policy | 5xx rate, plus business rejections by reason code |
| Saturation | How full the most constrained resource is | Kafka consumer lag, connection pool usage, screening queue depth |
Two details matter for payments. Split latency by outcome, because a fast rejection averaged with slow successes produces a healthy-looking number while customers wait. And treat “implicit” errors seriously: an HTTP 202 for a payment that then waits an hour for a pacs.002 status report is a failure the status code never shows.
How do you write an SLO and an error budget?
An SLO is a target ratio of good events to valid events over a fixed window. Write it so a developer can compute it from a metric without asking you anything.
| Id | SLO | Good event | Window | Target |
|---|---|---|---|---|
| SLO-1 | Availability | POST /payments returns a non-5xx response | 30 days rolling | 99.9% |
| SLO-2 | Latency | POST /payments responds within 800 ms | 30 days rolling | 99% |
| SLO-3 | Instant outcome | SCT Inst payment gets a positive (ACCP) or negative (RJCT) confirmation within 5 s of receipt | 30 days rolling | 99.5% |
SLO-3 is the one most specifications miss, and it is the one the business cares about. The 2025 SCT Inst rulebook, effective 5 October 2025, sets a target maximum execution time of five seconds, so an outcome SLO aligned to that number turns a scheme rule into something you can monitor.
The error budget is the complement. A 99.9 percent target over 30 days allows 0.1 percent failure: 43.2 minutes of total outage, or 1,000 failed requests in every million. Write down what happens when it is spent, because that is the part that changes behaviour: for example, “when SLO-1’s budget is exhausted, non-urgent releases to the payment API pause until the 30 day ratio recovers”. Without that sentence, an SLO is a chart.
Which structured log fields does the specification require?
Logs must be structured (JSON, one object per line) so they can be searched by field rather than by regular expression. These are the fields I require on every log line that concerns a payment:
| Field | Example | Why |
|---|---|---|
timestamp | 2026-10-09T09:14:02.118Z | UTC, milliseconds, ISO 8601 |
level | INFO | ERROR and WARN must mean something |
service.name | payment-orchestrator | Who wrote it |
trace_id, span_id | 4bf92f35... | Jump from log to trace and back |
correlation_id | req-8d1f... | The API request that started it |
payment.id | PAY-20261009-000731 | Internal key |
payment.uetr | 7f4c1a20-9e6b-... | The key every bank shares |
event | payment.status_changed | A fixed vocabulary, not free text |
payment.status | RJCT | ISO 20022 status code |
payment.reason_code | AM04 | Mandatory when status is RJCT |
payment.scheme | SCT_INST | Splits every query |
{"timestamp":"2026-10-09T09:14:02.118Z","level":"INFO","service.name":"payment-orchestrator","trace_id":"4bf92f3577b34da6a3ce929d0e0e4736","span_id":"a3ce929d0e0e4736","correlation_id":"req-8d1f0c2a","event":"payment.status_changed","payment.id":"PAY-20261009-000731","payment.uetr":"7f4c1a20-9e6b-4d31-8a55-2c9d10bb4e77","payment.scheme":"SCT_INST","payment.status":"RJCT","payment.reason_code":"AM04"}And the negative requirement, which is the one that ends up in an audit finding when omitted: no log line contains a customer name, IBAN, address, remittance text, card number, or credential. The UETR is the reason you never need the IBAN to find a payment; the ISO 20022 identifier guide explains why it is the right key.
Which metrics, with which names and labels?
Name metrics once in the specification so dashboards and alerts do not each invent their own. Where OpenTelemetry already defines a stable metric, use it: http.server.request.duration is a histogram in seconds with http.request.method, http.route, and http.response.status_code attributes. A Prometheus exporter typically exposes it as http_server_request_duration_seconds. For business metrics, follow Prometheus naming: one unit, base units such as seconds, and _total on counters.
| Metric | Type | Labels |
|---|---|---|
payments_submitted_total | Counter | scheme, channel |
payments_completed_total | Counter | scheme, status (ACCP, ACSC, RJCT) |
payments_rejected_total | Counter | scheme, reason_code |
payment_outcome_duration_seconds | Histogram | scheme |
screening_request_duration_seconds | Histogram | outcome |
kafka_consumer_lag_messages | Gauge | topic, consumer_group |
The rule that saves the platform team: labels must be low cardinality. Prometheus warns that every unique combination of label values is a new time series, so a payment_id or uetr label turns one metric into millions of series. Identifiers belong in logs and traces. Metrics carry the categories you aggregate by.
The API contract and the metric catalogue are both part of a complete interface specification, and API Documentation from Scratch walks through writing one end to end.
What does an alert definition need?
Google’s SRE guidance is that pages should fire on symptoms users feel, require a human to act, and be rare enough not to be ignored. An alert specification needs seven things: name, condition, threshold, window, severity, owner, and runbook link.
For SLO-based paging, the SRE Workbook recommends multiwindow, multi-burn-rate alerts. For a 99.9 percent SLO, its starting point is to page when the burn rate exceeds 14.4 over one hour and over five minutes (2 percent of the 30 day budget spent), and to page at a burn rate of 6 over six hours and 30 minutes (5 percent spent). As a Prometheus rule:
groups:
  - name: payments-api-slo
    rules:
      - alert: PaymentsApiErrorBudgetFastBurn
        expr: |
          (
            sum(rate(http_server_request_duration_seconds_count{http_route="/payments",http_response_status_code=~"5.."}[1h]))
            / sum(rate(http_server_request_duration_seconds_count{http_route="/payments"}[1h]))
          ) > (14.4 * 0.001)
          and
          (
            sum(rate(http_server_request_duration_seconds_count{http_route="/payments",http_response_status_code=~"5.."}[5m]))
            / sum(rate(http_server_request_duration_seconds_count{http_route="/payments"}[5m]))
          ) > (14.4 * 0.001)
        labels:
          severity: page
          team: payments-core
        annotations:
          summary: "POST /payments is burning the 30 day error budget at 14x"
          runbook_url: "https://runbooks.bank.example/payments-api/error-budget-burn"
Business alerts sit alongside the technical ones, and they are the analyst’s to define:
| Alert | Condition | Severity | Runbook |
|---|---|---|---|
| Instant timeouts rising | AB05 or AB06 rejections above 1% of SCT Inst for 10 minutes | Page | Check CSM and beneficiary reachability |
| Screening slow | p99 screening above 1.5 s for 10 minutes | Page | Screening degradation |
| Rejection mix shift | Any reason code above 3x its 7 day baseline for 30 minutes | Ticket | Rejection triage |
| Payments stuck | Any payment awaiting its pacs.002 for more than 15 minutes | Page | Stuck payment recovery |
The last one catches the implicit failure the status code never shows. And every runbook link must resolve before go-live; a 404 runbook at 3 a.m. is its own incident. The production support skills piece covers what the person holding the pager actually does with it.
Which dashboards does each business outcome need?
Build dashboards around outcomes, not hosts. One payment API dashboard, top to bottom:
- Payments accepted and rejected per minute, by scheme. The first thing anyone on a bridge asks.
- Rejected by reason code, top ten, stacked. A sudden
AC04(closed account) spike means a data problem upstream; anAB05spike means a reachability problem downstream. - Latency against the SLO line, p50, p95, p99, split by outcome.
- Error budget remaining for each SLO, as a percentage of the window.
- Dependencies: screening, fraud, and clearing latency and error rate.
- Saturation: consumer lag, dead letter queue depth, connection pool usage.
Each panel names its metric in the specification. A dashboard nobody specified is a dashboard whose numbers nobody can explain in an incident review.
How do you write observability acceptance criteria in Gherkin?
Observability is behaviour, so it gets acceptance criteria and gets tested in SIT like anything else, using the same style as how to write API requirements.
Feature: Payment API observability

  Scenario: A rejected payment is logged, counted, and traceable
    Given a SCT Inst payment is submitted with insufficient funds
    When the payment is rejected
    Then one log line has event "payment.status_changed", status "RJCT", reason_code "AM04"
    And that log line carries payment.id, payment.uetr, trace_id, and correlation_id
    And payments_rejected_total{scheme="SCT_INST",reason_code="AM04"} increases by 1
    And no log line for the payment contains the debtor IBAN or name

  Scenario: Trace context survives the Kafka hop
    Given a payment is submitted with a valid traceparent header
    When the payment is consumed from the payment.received topic
    Then the consumer span belongs to the same trace or links to the producer span
    And every span for the payment carries payment.uetr

  Scenario: The fast-burn alert fires and points to a runbook
    Given a fault injection returns 5xx for 2% of POST /payments requests in SIT
    When the condition has persisted for one hour
    Then PaymentsApiErrorBudgetFastBurn fires with severity "page"
    And its runbook_url returns HTTP 200
The second scenario is where most estates fail, and the reason is in OpenTelemetry traces for analysts: a producer that does not write traceparent into the Kafka record headers splits every payment into two unrelated traces.
The takeaway
Observability requirements are ordinary requirements with unusual subjects. Write the SLOs as ratios with a window and a target, and state what happens when the error budget is spent. Name the log fields, make the UETR and payment id mandatory, and ban personal data explicitly. Name the metrics with low-cardinality labels, define each alert with a threshold, window, severity, owner, and working runbook link, and lay the dashboard out by business outcome. Then prove all of it in SIT with Gherkin, the same way you prove the payment itself works.
Ahmed is a Senior Technical Business Analyst with 10+ years in banking and payments. He builds practical guides and tools for analysts at The Tech BA Toolkit.
Tags: Observability, Non-Functional Requirements, SLOs, APIs, Payments
About the author
Analyst Engineering is written by Ahmed, a Senior Technical Business Analyst with 10+ years of banking and payments delivery experience: ISO 20022 and SWIFT messaging, payments API integration, Kafka event validation, and production support. Every article comes from real delivery work, and each one is reviewed and updated as tools and standards change.
Related articles
- Non-Functional Requirements: The Categories, With Measurable Examples What non-functional requirements are, the categories that matter, and how to write testable NFRs with measurable targets instead of adjectives. With examples.
- How to Write API Requirements That Developers Can Actually Build How to write API requirements: endpoint, method, request and response schema, status codes, error contracts, and testable acceptance criteria. With examples.
- The Production Support Skills Nobody Teaches Analysts Production support skills for technical analysts: triage, tracing transactions, reading logs, staying calm, and turning incidents into requirements.
- Reading Production Logs: Trace One Transaction's Trail How an analyst reads production logs to debug a system: correlation ids, log levels, searching by transaction, and following one request across services.
Go deeper on this
Not ready to buy? The free downloads are a no-cost place to start, and every article here stays free.
Free account
Practice on the Labs, keep your progress
A free account, no password: an email link signs you in. It saves your steps and self-assessments on the Labs, shows your missions on a dashboard, unlocks the solutions, and, if you tick the box, sends you new missions and articles when they ship.
Your email is used to sign you in. Nothing else, unless you ask. Privacy.